Product-Market Fit: What It Is, How to Measure It and How to Find It in 5 Steps

Most founders don't have a marketing problem. They have a fit problem. They run ads, hire a salesperson, post every day, and growth still feels like pushing a car uphill. Every new customer takes enormous effort, and half of them quietly leave a few months later.
That feeling has a name, and so does its opposite. This guide shows you how to find product market fit in a business you can actually run: what product-market fit really means in the words of the person who coined the popular definition, how to measure it with a survey and a retention curve, and five steps to find it. You also get the full story of how Superhuman turned a 22% score into 58%, three worked use cases and the Claude prompts we use.
The short version:
- Product-market fit means a good market pulling your product out of your hands, not you pushing it into theirs.
- You can measure it: if at least 40% of real users would be "very disappointed" without your product, you are close.
- The second test is retention: fit shows up as a cohort curve that stops falling and flattens.
- You don't find fit by adding features for everyone. You find it by narrowing to the people who love you and building for them.
- Treat the fit score as your most important number and track it every week until it moves.
What is product-market fit?
Product-market fit is the point where a product satisfies a strong market so well that demand pulls the company forward. Marc Andreessen, who popularized the term, defined it in his 2007 post "The only thing that matters" as "being in a good market with a product that can satisfy that market." In plain terms: the right people want what you built badly enough that growth stops being a fight.
Andreessen also described what each side feels like. Without fit, customers don't get much value, word of mouth doesn't spread, usage grows slowly and deals drag on and die. With fit, customers buy as fast as you can deliver and usage grows as fast as you can add capacity (pmarchive). His conclusion for any early company: getting to product-market fit is the only thing that matters.
The trap is that fit is easy to feel and hard to prove. Founders confuse a good launch week, a few loud fans or a big deal with fit. That is why you need numbers.
The core: two ways to measure product-market fit
There are two tests worth running. One is a leading indicator you can measure this week. The other is a lagging indicator that confirms the first one over months.
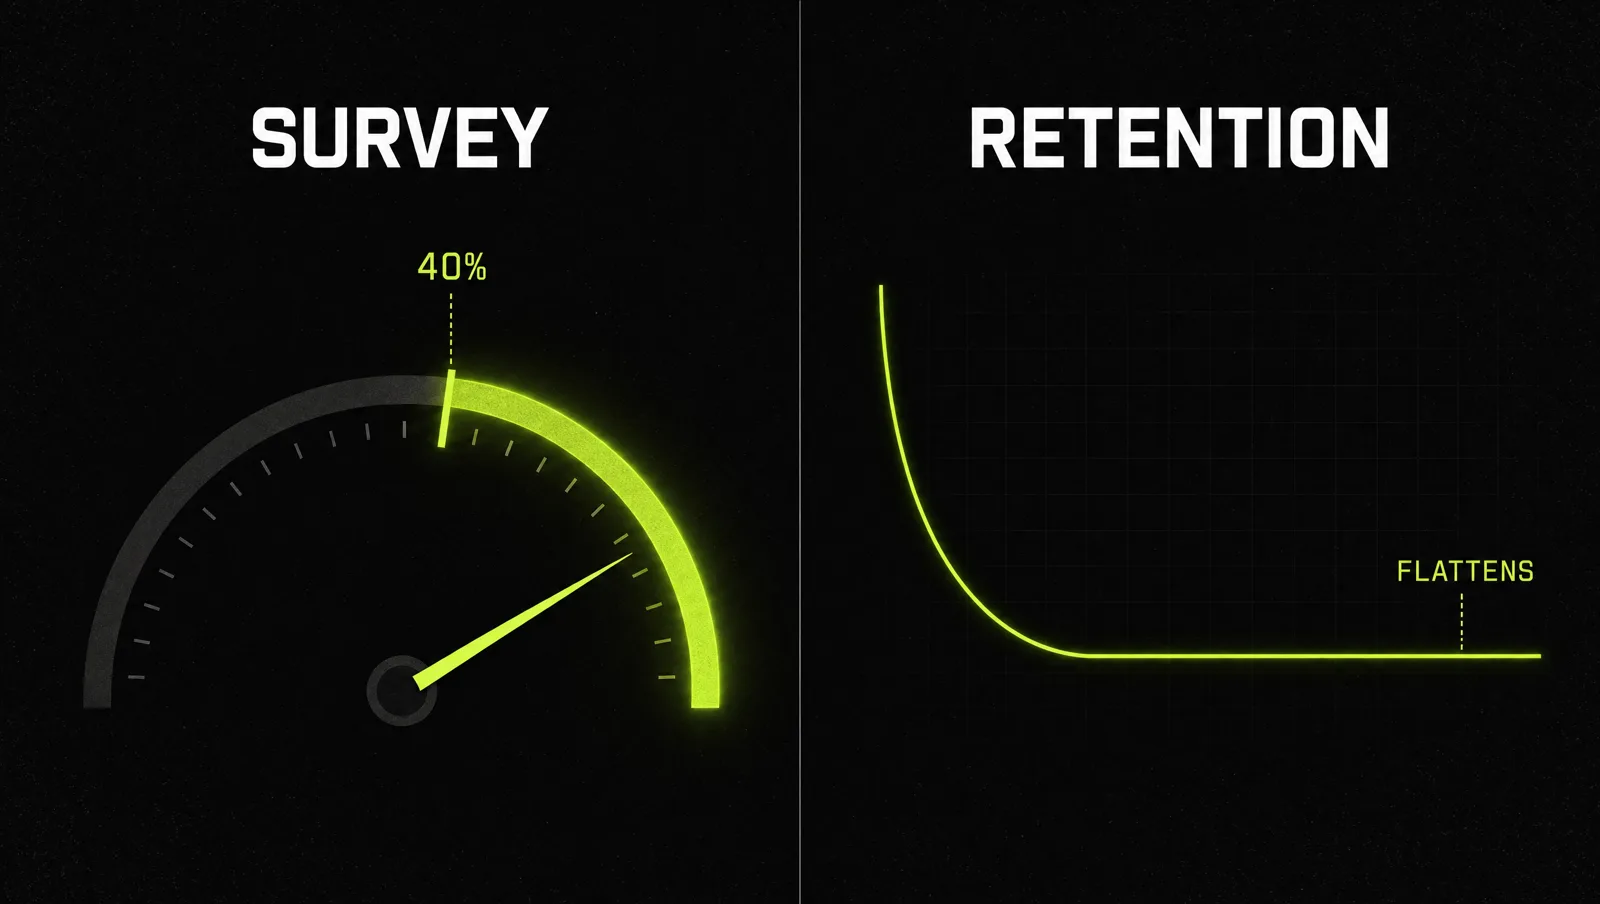
Test 1: the Sean Ellis survey. Ask active users one question: how would you feel if you could no longer use this product? The answers are very disappointed, somewhat disappointed or not disappointed. Growth advisor Sean Ellis benchmarked around a hundred startups with this survey and found a clear line: companies that struggled to grow almost always had fewer than 40% answer "very disappointed", while companies with strong traction almost always had more (First Round Review).
Test 2: the retention curve. Take every group of customers who started in the same month and plot what share of them is still active in each following month. Every curve drops at first. The question is whether it keeps dropping toward zero or flattens into a stable base. Andreessen Horowitz partners describe a curve that stabilizes after the early churn as the signal of genuine fit, and note that for monthly billing, customers still there after month 3 show real staying power (a16z, 2025).
| Sean Ellis survey | Retention curve | |
|---|---|---|
| What it measures | How much users would miss the product | Whether users actually keep using or paying |
| Signal of fit | 40% or more say "very disappointed" | The cohort curve flattens instead of sliding to zero |
| Type of indicator | Leading: tells you where you are heading | Lagging: confirms fit after months |
| Sample you need | Around 40 responses give a direction (First Round Review) | A few monthly cohorts with enough customers each |
| Main risk | Surveying the wrong people | Waiting too long to act on the answer |
Use both. The survey tells you what to change this month. The retention curve tells you whether the change worked.
How to find product-market fit in 5 steps
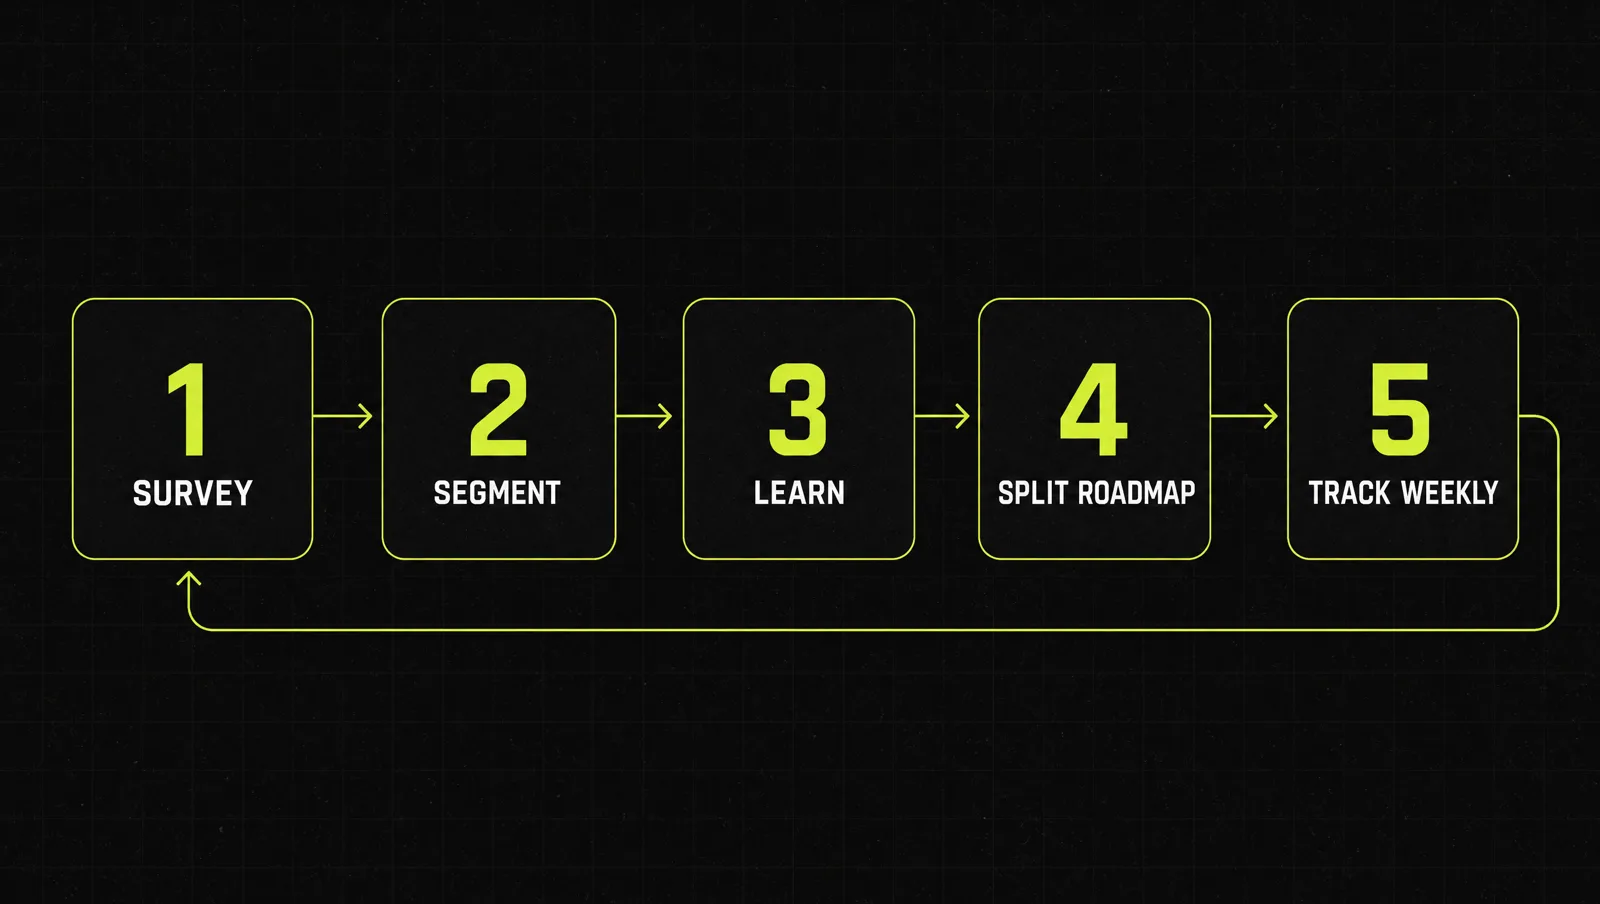
Step 1: Survey the right users
Only ask people who have really used the product: recent, active users who have experienced its core. Ask four questions: how they would feel without the product, what type of person would benefit most, what main benefit they get, and how you could improve it. This is the survey Superhuman used (First Round Review). Calculate your score: the share who answer "very disappointed".
Step 2: Segment down to the people who love you
Don't average everyone together. Look only at the "very disappointed" group and ask who they are: role, company type, situation. Then recalculate the score for just that segment. It will almost always be higher. That segment is your market for now. Describe your most demanding ideal user in one sentence, and stop building for everyone else.
Step 3: Learn why they love it
Read the answers to "what is the main benefit?" from your lovers. One or two themes will dominate. That theme is your real value, and it is often different from what your homepage says. This is where the Jobs to Be Done framework helps: the benefit people name tells you the job they hired your product for.
Step 4: Split the roadmap in half
Now look at the "somewhat disappointed" users. Ignore the ones who don't care about your main benefit. Focus on the ones who do, and ask what holds them back. Spend half of your effort doubling down on what your lovers love and half removing what stops the fence sitters from loving it too. Ignore the "not disappointed" group entirely.
Step 5: Track the score every week
Make the "very disappointed" percentage the number the whole team sees. Rerun the survey on new users regularly, watch the score for your segment, and check each new monthly cohort on the retention curve. When the score passes 40% and the curves flatten, stop tinkering with the core and start pouring fuel on growth. That is also when a real lead system starts paying off, because each new customer now stays.
A real case: how Superhuman built a product-market fit engine

Rahul Vohra, founder and CEO of the email app Superhuman, described his process in detail in First Round Review. The facts below come from that article.
- By summer 2017, the team had been building for two years and had not launched. Vohra felt pressure to launch, but thought that simply launching to see what happens would be reckless. He needed a way to measure fit.
- He adopted Sean Ellis's survey. The first result: 22% of users said they would be very disappointed without Superhuman, far below the 40% line.
- Segmenting to the groups where love was concentrated (founders, managers, executives and business development people) lifted the score to 33% with almost no product work.
- Lovers named speed as the main benefit. Among the somewhat disappointed users who also valued speed, the main blocker was the lack of a mobile app, followed by requests like integrations, calendaring, a unified inbox and better search.
- Half the roadmap went to what users loved (more speed, more shortcuts, more automation), half to what held others back.
- The very disappointed percentage became the team's most visible metric, tracked weekly, monthly and quarterly, and the product team's OKR had it as the only key result.
- Within three quarters, the score reached 58%.
Look at it through the system:
- Measure first: Vohra refused to guess and put a number on fit before launching.
- Segment: about a third of the total gain came from choosing the right audience, not from building anything.
- Learn the benefit: speed became the filter for which feedback mattered.
- Split the roadmap: double down on the love, remove the blockers for the near fans.
- Track weekly: one number, visible to everyone, owned by the product team.
The lesson: Superhuman didn't find fit by pleasing more people. It found fit by deciding exactly who the product was for, then building relentlessly for them.
Three use cases
The examples below are illustrative, not real clients. They show how the same system works in very different businesses.
Use case 1: Marketing agency
Before: serves any business that pays, from restaurants to software companies. Clients churn after three months and referrals are rare.
After: surveys all current and past clients. The very disappointed answers cluster around dental practices, who name "new patients booked without us chasing them" as the main benefit. The agency narrows to dental practices, packages that benefit, and fixes the one blocker the near fans mention: slow monthly reporting. Client lifetime grows and the retention curve for new cohorts flattens.
Use case 2: Coach or creator
Before: a general "grow your business" program. Many signups, low completion, lots of refunds.
After: the survey shows the students who would miss the program most are freelance designers raising their prices for the first time. The creator rebuilds the program around that single outcome, cuts modules nobody used, and adds pricing templates the fence sitters asked for. Completion and renewals go up.
Use case 3: SaaS or digital product
Before: a project tool for "all teams" with a long feature list and a retention curve sliding toward zero.
After: the score is 18% overall, but 41% among small video production studios. The team makes that segment the target, doubles down on the review workflow they love, and ships the client sharing feature the near fans lack. New monthly cohorts start to flatten after month 3.
How we run this with Claude
Inside CopyPasteCEO we run this as a set of Claude prompts, in one chat so Claude keeps the context. Here are the first two, copy-paste ready. Fill in the brackets.
Prompt 1: score and segment your survey results
Make it yours · 0/1 filled
You are a product-market fit analyst trained on the Sean Ellis survey and the Superhuman segmentation method. Here are my raw survey answers, one row per user, with role, company type and their answers to the four questions: [PASTE SURVEY DATA]. Calculate the overall share of "very disappointed" answers. Then find the segment with the highest share and recalculate the score for that segment only. Describe that segment's ideal user in one sentence and tell me which segments I should stop building for.Prompt 2: build the split roadmap
Make it yours · 0/4 filled
My product: [WHAT YOU SELL], for [TARGET SEGMENT]. The main benefit my "very disappointed" users name is: [MAIN BENEFIT]. Here is the feedback from "somewhat disappointed" users: [PASTE FEEDBACK]. Remove every piece of feedback from users who do not value [MAIN BENEFIT]. Group the rest into themes and rank them by how often they appear. Then give me a roadmap for the next 90 days: half the items doubling down on [MAIN BENEFIT], half removing the top blockers. One sentence per item on why it moves the score.These two prompts give you a score, a segment and a roadmap. Deciding which segment to commit to, and holding that line when a big customer outside it asks for something, is where most people get stuck, because that is where judgment matters more than templates.
Where most people get stuck
Understanding product-market fit takes an afternoon. Committing to a narrow segment and measuring it every week takes discipline. The usual reasons people stop:
- They never measure. Fit stays a feeling, so every good week looks like fit and every bad week looks like a marketing problem.
- They can't let go of the lukewarm users. Building for everyone keeps the score stuck in the low twenties.
- They scale too early. They pour money into ads before the retention curve flattens, and pay to fill a leaking bucket.
That is exactly the gap the Inner Circle is built for: the playbooks to measure and find your fit, a new playbook every week, and founders who are running the same system next to you.